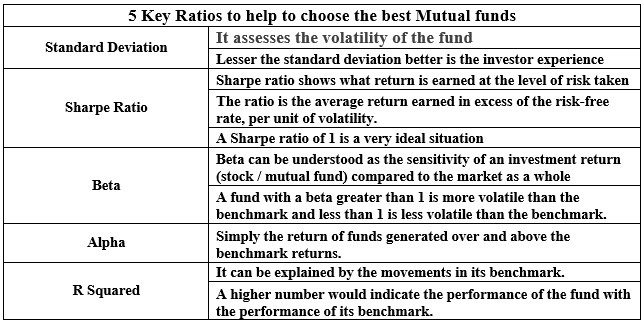
5 Key ratios to help you choose the best mutual funds. Investing in mutual funds can be a smart way to grow your wealth, but picking the right fund isn’t always straightforward. With countless options available, understanding how to evaluate funds is critical. Certain key financial ratios can help you effectively assess a fund’s performance and risk profile. Here’s a breakdown of 5 Key Ratios to guide your mutual fund selection.
1. Standard Deviation: Understanding Fund Volatility
What Is Standard Deviation?
In the world of investing, standard deviation measures a mutual fund’s return variability. In simpler terms, it reflects how much a fund’s returns fluctuate compared to its average performance over time.
Why Does It Matter?
A lower standard deviation generally indicates a steadier performance, translating to a better investor experience. While chasing high returns is tempting, the associated risks shouldn’t be ignored. During bullish markets, investors often overlook volatility, but when markets dip, high volatility can lead to significant losses.
How to Use This Ratio?
Opt for funds with lower standard deviations if you prioritize stability over high-risk, high-reward scenarios. This ratio is particularly useful for risk-averse investors.
2. Sharpe Ratio: Risk-Adjusted Returns
What Is the Sharpe Ratio?
The Sharpe ratio measures the return earned for each unit of risk taken. It is calculated as the fund’s excess return over the risk-free rate divided by its volatility.
Why Is It Important?
A higher Sharpe ratio indicates better risk-adjusted returns. For example, if a fund has a Sharpe ratio of 1, it means the fund is generating returns equivalent to the risk taken. A ratio below 1 may suggest the fund isn’t compensating adequately for the risk involved.
How to Use This Ratio?
Look for funds with a Sharpe ratio close to or above 1. These funds strike a balance between risk and reward, making them ideal for most investors.
3. Beta: Sensitivity to Market Movements
What Is Beta?
Beta measures a fund’s sensitivity to market fluctuations. A beta value of 1 implies the fund moves in tandem with the market. A beta greater than 1 indicates higher volatility, while a beta less than 1 suggests lower volatility.
Why Is Beta Useful?
Understanding beta helps you gauge a fund’s behavior during market ups and downs. For instance, if a fund has a beta of 0.7, it’s 30% less volatile than the market. Conversely, a beta of 1.3 indicates 30% more volatility.
How to Use This Ratio?
If you prefer conservative investments, choose funds with a beta below 1. Aggressive investors seeking higher returns may opt for funds with a beta above 1.
4. Alpha: Measuring Fund Manager Performance
What Is Alpha?
Alpha represents the excess return a fund generates over its benchmark on a risk-adjusted basis. It reflects the value added by the fund manager’s investment strategy.
Why Is It Significant?
Alpha indicates whether a fund manager is effectively outperforming the market after accounting for risk. Positive alpha means the fund is delivering superior returns, while negative alpha suggests underperformance.
Example of Alpha Calculation
Consider two funds with identical returns:
- Fund A: Beta = 0.8
- Fund B: Beta = 1.2
If both funds generate a return of 10%, and the benchmark returns 8%, Fund A’s alpha would be higher, indicating better risk-adjusted performance.
5. R-Squared: Correlation with Benchmark Performance
What Is R-Squared?
R-squared shows the extent to which a fund’s movements are influenced by its benchmark index. The values range from 0 to 100, with higher values indicating a stronger correlation.
Why Does It Matter?
Funds with high R-squared values (85–100) closely track their benchmarks. A low R-squared value (below 70) suggests the fund behaves differently from the index, which could be a sign of unique investment strategies.
How to Use This Ratio?
Choose funds with a high R-squared if you want performance aligned with the benchmark. For greater diversification, consider funds with moderate R-squared values.

How to Apply These Ratios in Your Investment Journey
Step 1: Define Your Investment Goals
Are you looking for steady growth, aggressive returns, or a balance? Understanding your goals will help you prioritize specific ratios.
Step 2: Analyze Fund Performance
Use these ratios in combination rather than in isolation. For example, a fund with a high Sharpe ratio but low alpha may not meet your expectations.
Step 3: Consider Your Risk Tolerance
If you’re risk-averse, focus on funds with low beta and standard deviation. If you’re comfortable with volatility, higher beta and alpha funds may be suitable.
5 Key Ratios Choose the right mutual fund requires a clear understanding of key performance metrics. Ratios like standard deviation, Sharpe ratio, beta, alpha, and R-squared provide valuable insights into a fund’s risk, return, and alignment with your investment goals. By incorporating these metrics into your decision-making process, you can make informed choices that align with your financial objectives.
FAQs
1. What is the best ratio for evaluating mutual funds?
The Sharpe ratio is often considered one of the best metrics for assessing risk-adjusted returns, but it’s essential to use it alongside other ratios like alpha and beta.
2. How does alpha differ from beta?
Alpha measures a fund’s excess return over the benchmark, while beta indicates its sensitivity to market movements.
3. Can I rely solely on R-squared to choose a fund?
No, R-squared should be used in combination with other ratios. High R-squared values indicate benchmark correlation but don’t provide insights into risk-adjusted performance.
4. Is a low standard deviation always better?
Not necessarily. While low standard deviation suggests stability, it’s important to consider your risk tolerance and investment goals.
5. How do I find these ratios for a mutual fund?
Most financial websites and fund fact sheets provide these ratios, making it easy to compare different funds.
Other Articles:


